Regression is a method, which allows to explore the connection between some characteristics (variables) of data, and using that to predict unknown values.
In simple words we can for example use it to predict how much fuel is needed to travel x kilometers based on engine type, engine size, and weight of a vehicle.
For using regression, we are assuming that variance of data is constant. Usually there is also assumption that data has normal distribution.
Linear Regression
Linear regression tries to create a single straight line, which will have lowest distance from all points to created line.
from sklearn.linear_model import LinearRegression
import pandas as pd
import numpy as np
import matplotlib.pyplot as plt

csv = pd.read_csv('mtcars.csv')
X = csv[['wt']] # Features
y = csv[['mpg']] # Target

regression = LinearRegression().fit(X, y)

predict = {
  'wt': [2.50]
}

prediction_result = regression.predict(pd.DataFrame(predict))[0][0]

y_pred = regression.predict(X)
mse = mean_squared_error(y, y_pred)
rmse = np.sqrt(mse)

display(f'This model have R2 = {regression.score(X, y)} in range (0,1)')
display(f'This model have MSE = {mse}')
display(f'This model have RMSE = {rmse}')
display(f'For a car with this parameters {predict} '
        f'it predicts {prediction_result} mpg.')

ax = csv.plot.scatter(x='wt', y='mpg')
x_range = np.linspace(X.min(), X.max(), 100) # 100 evenly spaced values from min to max of hp
y_range = regression.predict(x_range)

ax.plot(x_range, y_range, color='orange', linewidth=2)
ax.scatter(predict['wt'], prediction_result, color='cyan')

for i in range(len(csv)):
	wt = csv['wt'][i]
	mpg = csv['mpg'][i]
	predicted_mpg = regression.predict([[wt]])[0][0]
	ax.plot([wt, wt], [mpg, predicted_mpg], color='gray', linestyle='--')

plt.show()
‘This model have R2 = 0.7528327936582646 in range (0,1)’ ‘This model have MSE = 8.697560548229477’ ‘This model have RMSE = 2.949162685955028’ “For a car with this parameters {‘wt’: [2.5]} it predicts 23.923947235535348 mpg.”
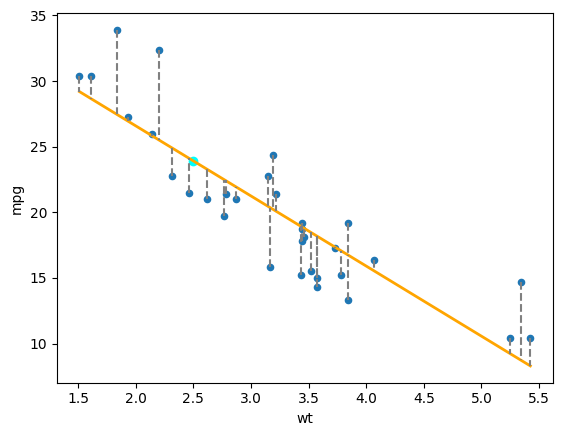
Blue dots on this graph, are entries from mtcars - our original data, orange line represent fitted model using linear regression - it’s a single straight line, to which average distance is smallest. Cyan dot is our prediction on what mpg a car with 2.5t weight will have.